Features
Walkthrough of each dashboard screen served by alpha-vis serve.
Browse
Strategy library with search. Includes the Symbol Atlas grouped by asset class, Saved Views (preset filters), and a groupable Strategy Ledger.
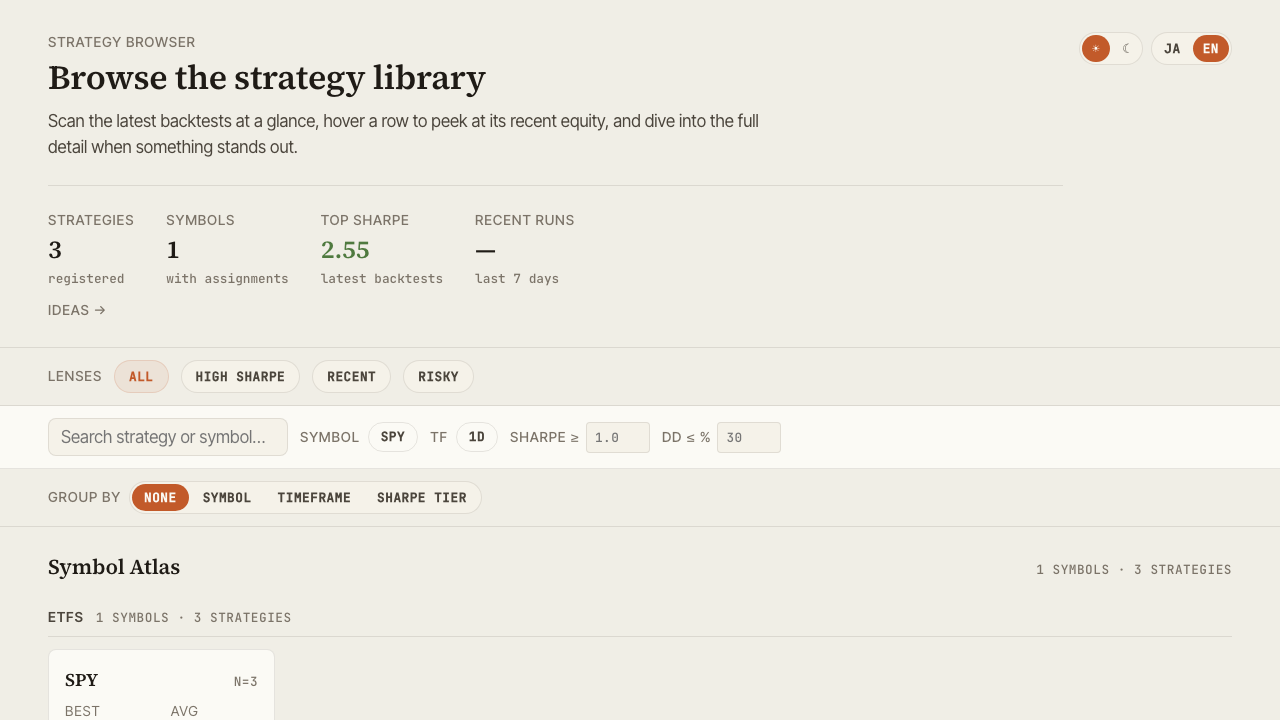
Key actions:
- Filter by symbol / timeframe / Sharpe tier
- Save your favorite filter combinations as Saved Views
- Open the global command palette with
Cmd+K/Ctrl+K - Click a row to expand the slide panel, or jump to Detail
selectedId and compareIds are synchronized to URL query parameters, so a particular selection state can be shared via URL.
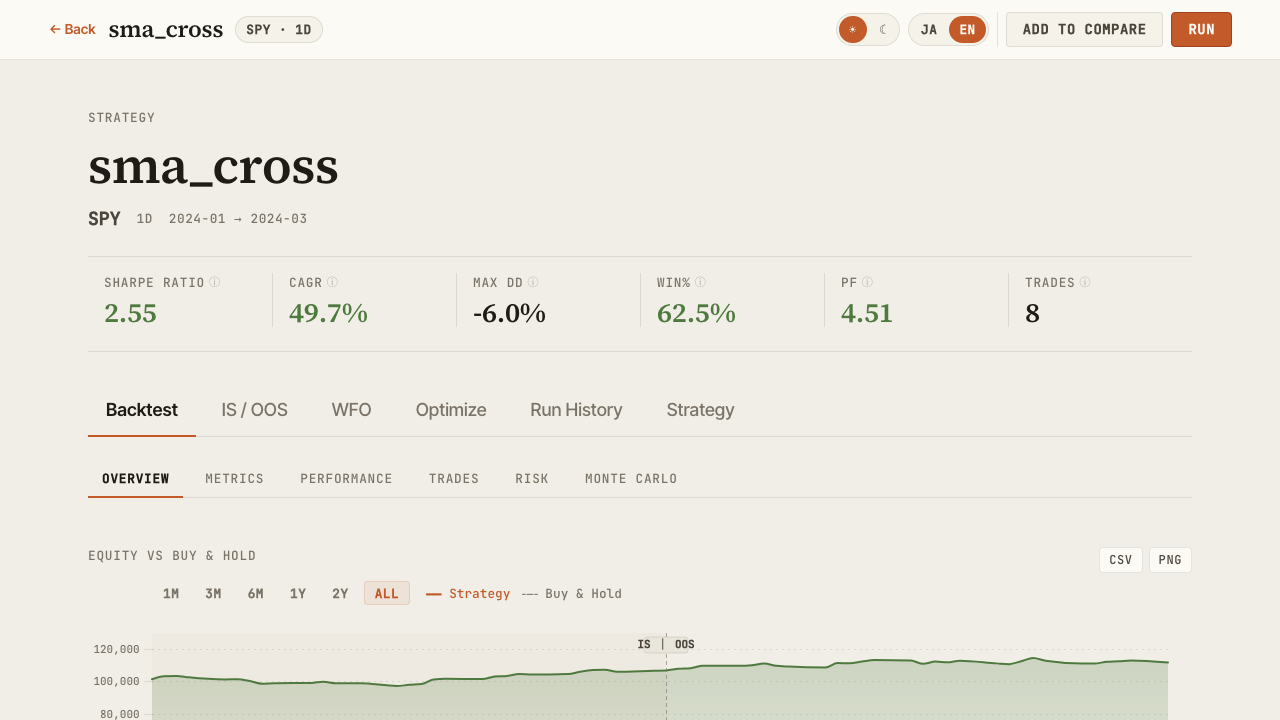
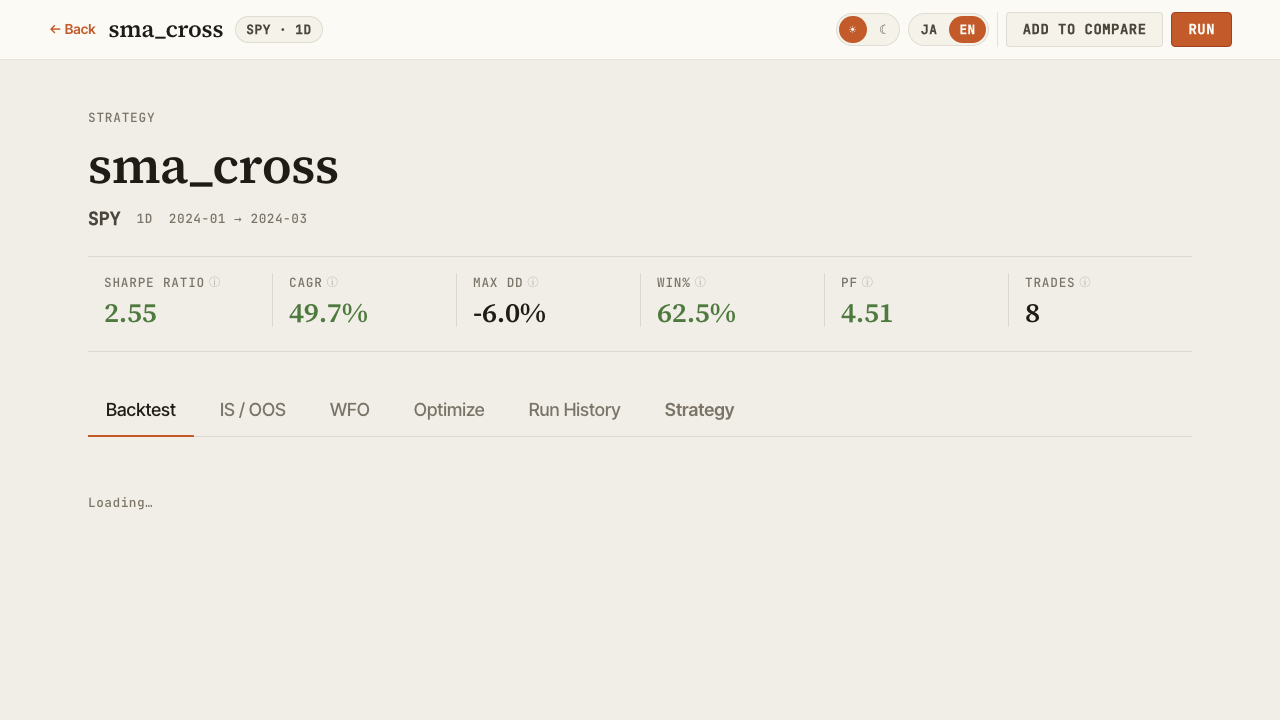
Detail
Multi-faceted view of a single strategy's backtest.
Tabs:
| Tab | Contents |
|---|---|
| Backtest | Equity / Drawdown / Underwater / trade list / benchmark metrics (alpha, beta, IR, correlation) / annual returns |
| IS / OOS | In-Sample vs Out-of-Sample metric comparison |
| WFO | Walk-Forward composite equity and per-window results |
| Optimize | Grid optimization heatmaps and parameter-vs-metric scatter plots |
| Run History | List of past backtest runs |
| Strategy | Indicators, entry/exit rules, and risk management as structured tree |
Compare
Side-by-side view of multiple strategies.
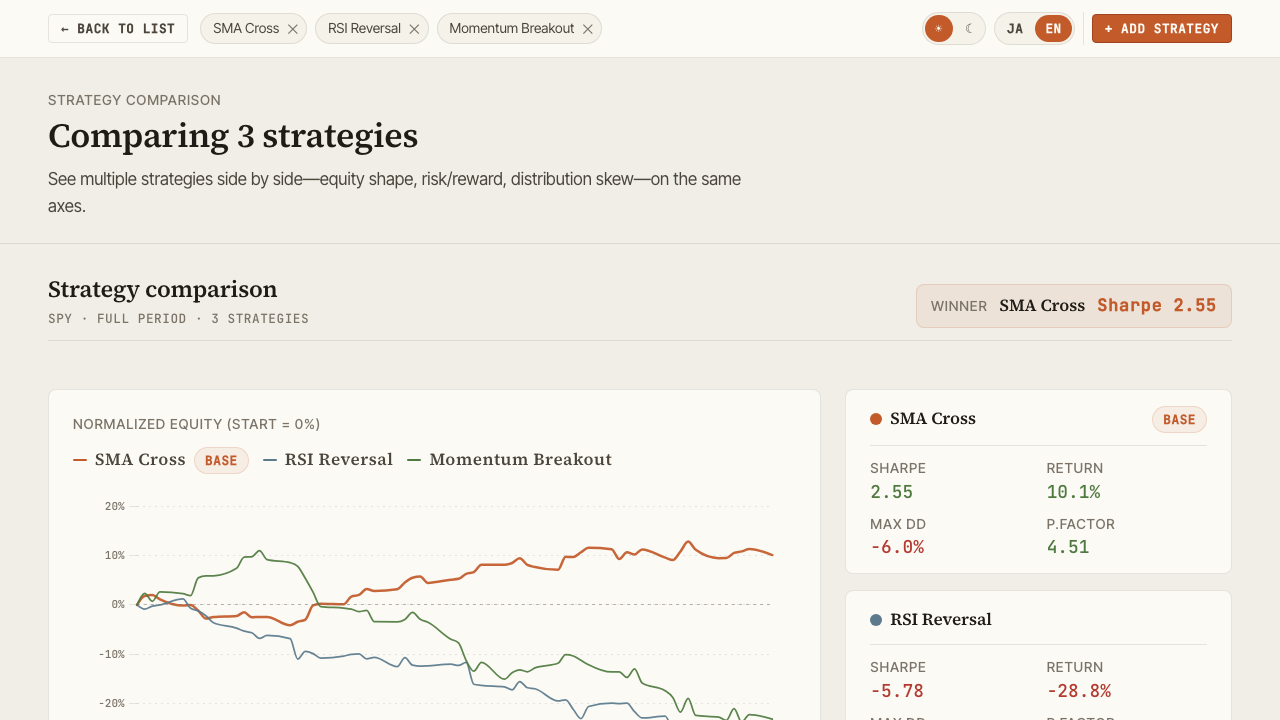
- Parallel metric cards (CAGR / Sharpe / Sortino / MaxDD / Profit Factor, etc.)
- Overlaid equity curves
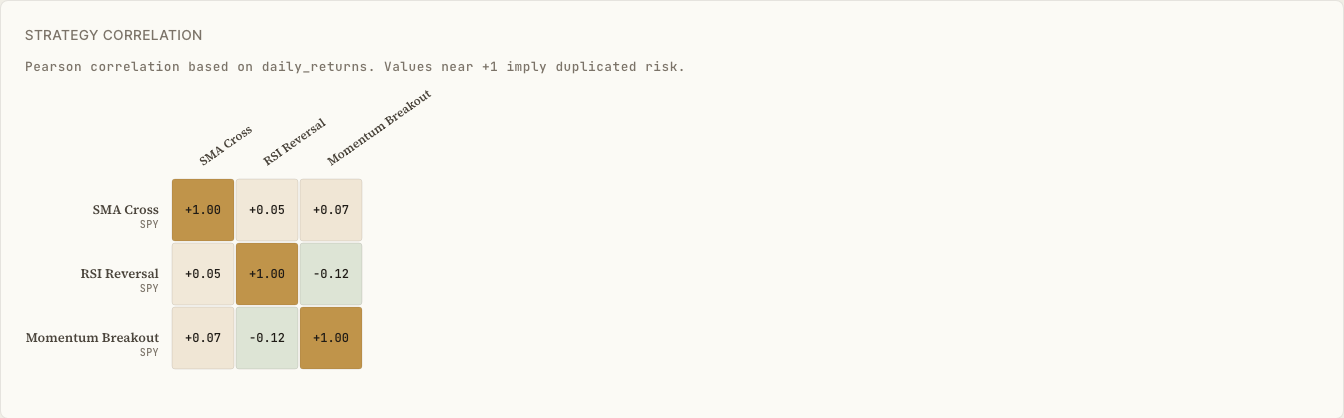
- Pearson correlation heatmap (normalized to overlapping period)
Optimize
Visualize optimization results.
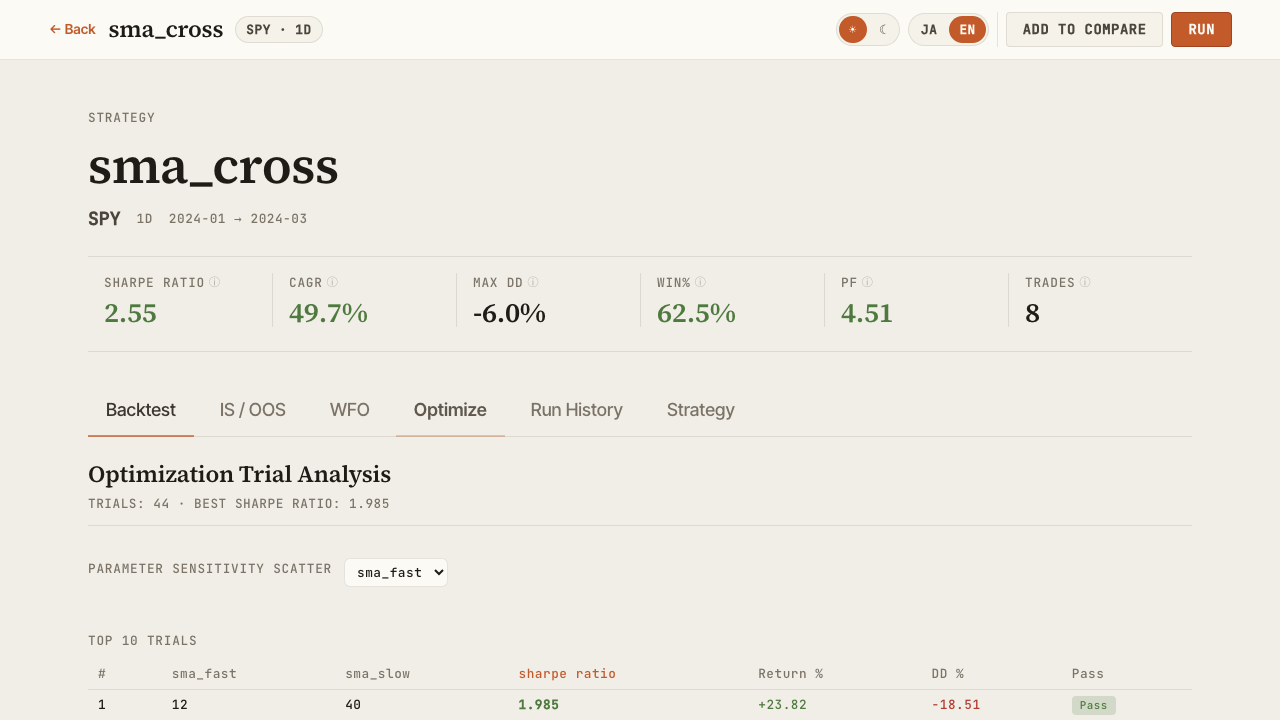
- Scatter plot (parameter vs. metric) and a two-parameter × metric heatmap, switchable via tabs (pick the X/Y parameters and the target metric; cell color = mean metric value for that parameter combination, hover shows the parameter pair, mean, and trial count)
- Walk-Forward Test composite equity curve
- Per-window performance trajectory
Strategy structure
Visualize the structure of a strategy JSON.
- Indicators and their parameters
- Entry / exit conditions
- Risk management (stop logic, position sizing)
- Target symbols and timeframe
Live
Browse live / paper trading records and compare them against backtests. Accessible at /live, or via the "Live →" link in the Browse header.
- Lists every entry with live records (both per-strategy and combine portfolios)
- Per-strategy (trade-based): total trades, win rate, profit factor, max drawdown, and net PnL compared with the period-aligned backtest, with diffs
- Combine portfolios (position-based): total return, CAGR, Sharpe ratio, max drawdown, and volatility with the live equity curve, compared against the backtest combine
- The selected entry is synced to the URL query (
?id=) for sharing
Live records imported into backtest_results.db via the AlphaForge CLI (alpha-forge live sync-events → live import-events / live replay) appear automatically.
Ideas
Browse exploration ideas and their state.
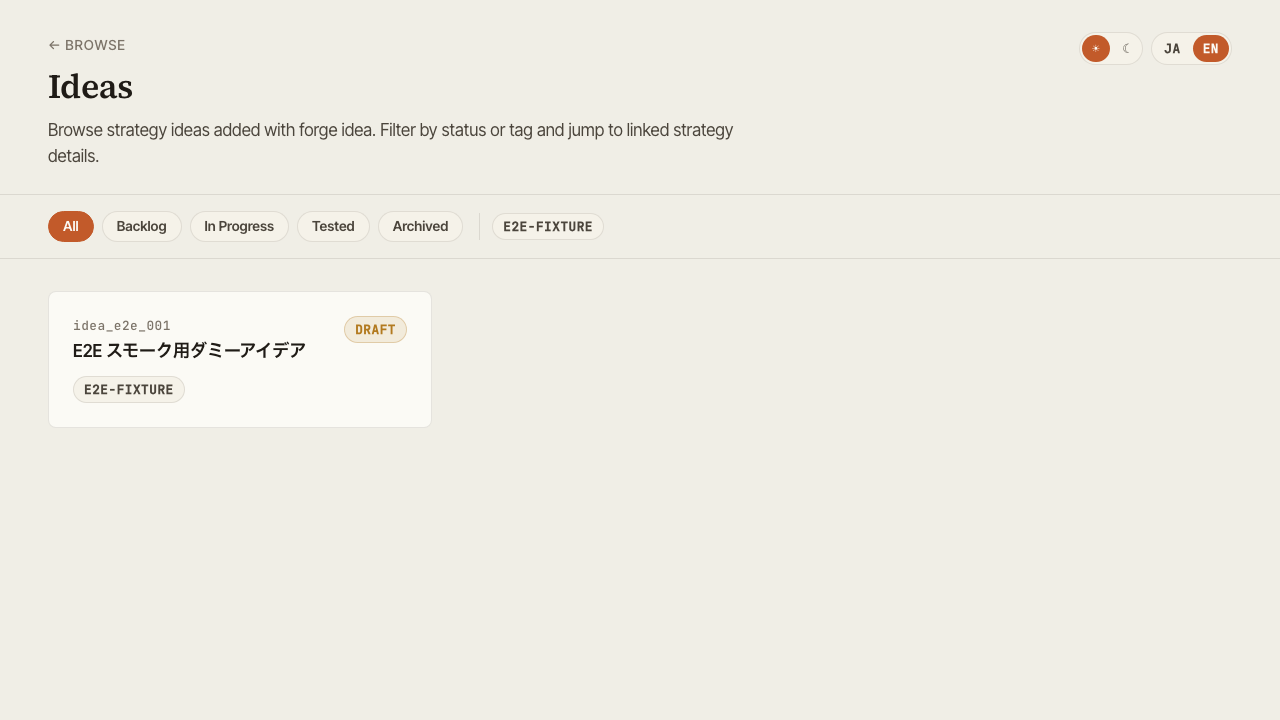
- Filter by status (pending / exploring / promoted / archived, etc.)
- Filter by tag
- Linked strategies tie ideas to their implementations
Cross-cutting features
Global search (Cmd+K)
Cmd+K (macOS) / Ctrl+K (Windows / Linux) opens a command palette from any screen, letting you jump by strategy name or screen name.
Theme toggle
Top-right toggle switches between dark and light. Preference is stored in browser localStorage.
Language toggle
Switch UI between Japanese and English — useful for screenshots or sharing with international teammates.
Export
- CSV — download trade history / metric tables from any panel
- PNG — save charts as static images
- URL share — Browse / Compare selection state is synced to query string, so copying the URL shares the view