Output Examples
What you get when you run AlphaForge CLI — representative commands and their outputs.
About sample output
Numbers on this page are samples based on formats read from the alpha-forge source. Actual values will vary by data and strategy.
Backtest Results
Command
Text Output
Running backtest: SPY x sma_crossover_v1
✅ Backtest complete  Signal quality score: 0.78/1.0
Total return: +52.30%  CAGR: 5.40%
SR: 0.92  Sortino: 1.15  Calmar: 0.32
MDD: -16.80%  Duration: 187d  Recovery: 92d
PF: 1.74  Win%: 50.0%  avg win: 4.20%  avg loss: -2.40%
Kelly: 0.21  Payoff: 1.75  Expectancy: 0.90%/trade  GPR: 0.42  Ulcer: 0.0480  Recovery: 3.11
Trades: 14  Avg hold: 28.5d(28bar)  Max: 65.0d(65bar)  Win streak: 4  Loss streak: 3
Win rate CI(90%): 35.2% - 64.8%
Key Metrics
| Metric | Value | Meaning |
|---|---|---|
| CAGR | 5.40% | Compound annual growth rate |
| Sharpe Ratio | 0.92 | Risk-adjusted return (target: ≥ 1.0) |
| Max Drawdown | -16.80% | Largest peak-to-trough loss (187d to recover) |
| Profit Factor | 1.74 | Gross profit ÷ gross loss (target: ≥ 1.3) |
| Win Rate | 50.0% | Percentage of winning trades |
JSON Output (with --json flag)
{
  "total_return_pct": 52.30,
  "cagr_pct": 5.40,
  "sharpe_ratio": 0.92,
  "sortino_ratio": 1.15,
  "calmar_ratio": 0.32,
  "max_drawdown_pct": -16.80,
  "max_drawdown_duration_days": 187,
  "recovery_days": 92,
  "profit_factor": 1.74,
  "win_rate_pct": 50.0,
  "total_trades": 14,
  "avg_holding_days": 28.5,
  "pre_filter_pass": false,
  "pre_filter": { "sharpe_min": 1.0, "max_dd_max": 25.0 },
  "warnings": []
}
Detailed Report (reviewing saved results)
=== sma_crossover_v1 / SPY (2026-04-15T10:30:21) ===
Total return: 52.30%  CAGR: 5.40%
SR: 0.92  Sortino: 1.15  Calmar: 0.32
MDD: -16.80%  PF: 1.74  Win%: 50.0%
Trades: 14  Avg hold: 28.5d(28bar)  Max: 65.0d(65bar)
Trade log: 14 entries (use --json to view all)
Use --json for the full trade log:
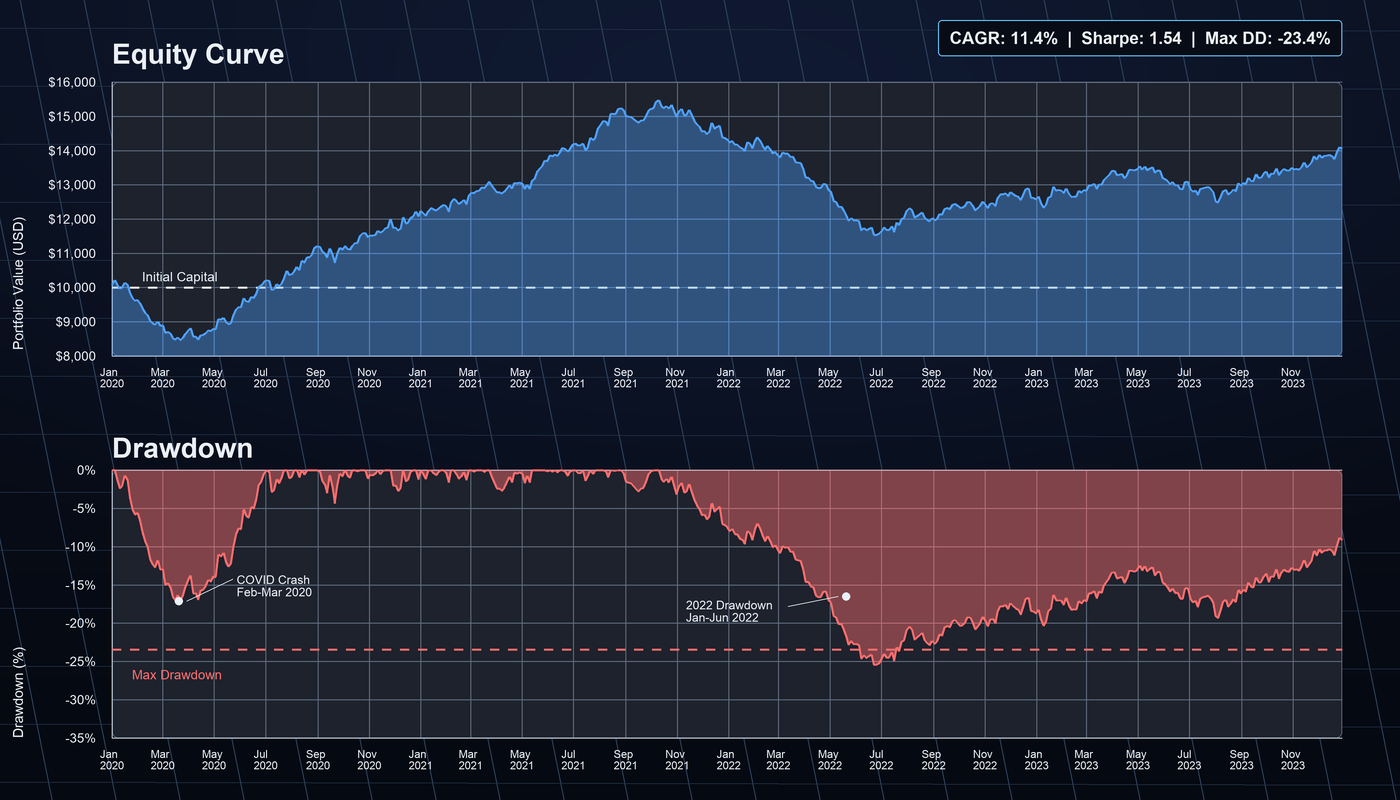
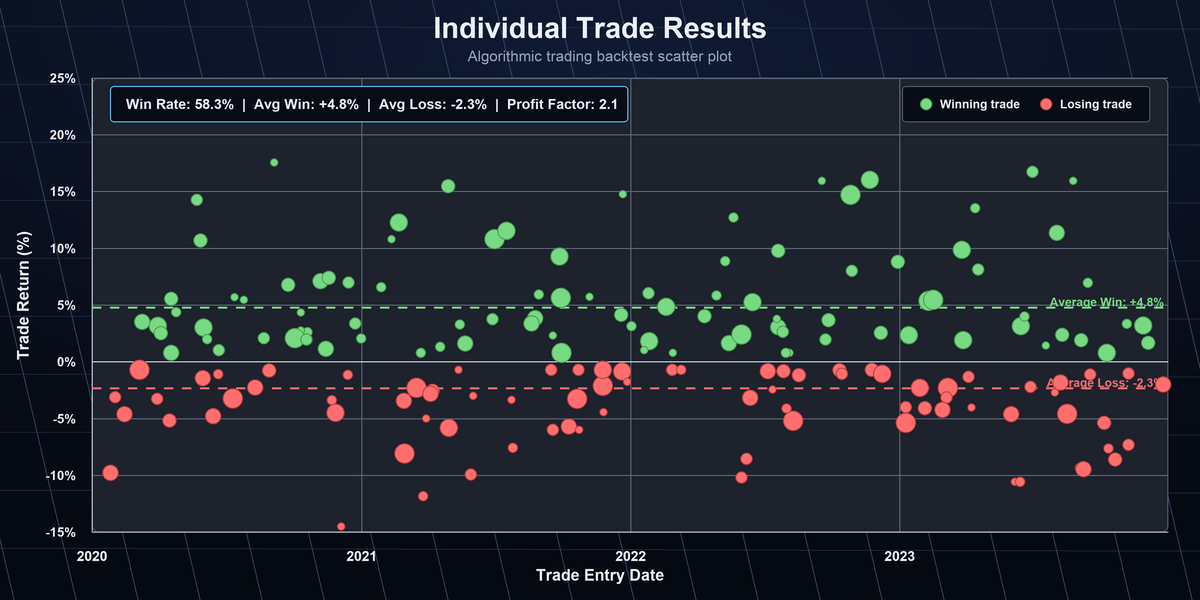
Equity Curve and Dashboard
After a backtest, use the local dashboard to visually inspect the equity curve, drawdown, and individual trades.
# Show chart URL
alpha-forge backtest chart sma_crossover_v1

# Open directly in browser (requires alpha-vis serve running)
alpha-forge backtest chart sma_crossover_v1 --open
The dashboard (alpha-vis serve) provides these tabs:
| Tab | Contents |
|---|---|
| Equity Curve | P&L curve, Buy & Hold comparison, monthly return bars |
| Drawdown | Max drawdown periods, recovery curve, drawdown distribution |
| Trades | Individual trade list (entry/exit date, P&L, holding period) |
| Statistics | Annual/monthly stats, key risk metrics |
Batch Backtest (compare multiple strategies)
Batch backtest started: SPY × 3 strategies (workers=3)
  ✅ sma_crossover_v1: Sharpe=1.32  MaxDD=-12.4%  CAGR=8.2%  trades=18
  ❌ rsi_reversion_v1: Sharpe=0.61  MaxDD=-22.1%  CAGR=4.1%  trades=24
  ✅ macd_trend_v1:    Sharpe=1.18  MaxDD=-15.6%  CAGR=7.0%  trades=15

Passed: 2/3 strategies
  ✅ sma_crossover_v1: Sharpe=1.32  MaxDD=-12.4%
  ✅ macd_trend_v1:    Sharpe=1.18  MaxDD=-15.6%
Parameter Optimization Results
✅ Optimization complete
Best score (sharpe_ratio): 1.32
Best params: {'fast_period': 12, 'slow_period': 50}
💾 Result file: data/results/optimize_sma_crossover_v1_20260415_103021.json
   Next: alpha-forge optimize apply data/results/optimize_sma_crossover_v1_20260415_103021.json --to-strategy sma_crossover_v1_optimized
DB saved: run_id=828cba05-7d4e-4f1a-9b2c-1a2b3c4d5e6f
About the Next: hint in the sample
The Next: line above reproduces the actual CLI output, but passing the displayed --to-strategy sma_crossover_v1_optimized verbatim registers a doubly-suffixed ID (sma_crossover_v1_optimized_optimized) — a known wording bug in the CLI hint. Pass the base ID without the suffix (--to-strategy sma_crossover_v1) as shown in the example below.
Machine-readable output with --json:
Apply optimized parameters to a strategy
# Pass the base ID (no suffix) to --to-strategy. The CLI appends _optimized automatically, registering sma_crossover_v1_optimized
alpha-forge optimize apply data/results/optimize_sma_crossover_v1_20260415_103021.json \
  --to-strategy sma_crossover_v1
Strategy JSON Validation
# Register and validate a strategy
alpha-forge strategy save data/strategies/sma_crossover_v1.json
alpha-forge strategy validate sma_crossover_v1
Pine Script Generation (Paid Plans)
Paid plans only
alpha-forge pine generate is available on paid plans only (Lifetime / Annual / Monthly). Not available on the Trial plan. See Trial Limits for details.
Sample generated Pine Script (SMA crossover strategy):
//@version=6
strategy("sma_crossover_v1", overlay=true,
         default_qty_type=strategy.percent_of_equity, default_qty_value=100)

// === Parameters ===
fast_period = input.int(12, "Fast Period", minval=1, maxval=200)
slow_period = input.int(50, "Slow Period", minval=1, maxval=500)

// === Indicators ===
sma_fast = ta.sma(close, fast_period)
sma_slow = ta.sma(close, slow_period)

// === Signals ===
long_entry = ta.crossover(sma_fast, sma_slow)
long_exit  = ta.crossunder(sma_fast, sma_slow)

// === Position management ===
if long_entry
    strategy.entry("Long", strategy.long)
if long_exit
    strategy.close("Long")

// === Plots ===
plot(sma_fast, color=color.blue, title="SMA Fast")
plot(sma_slow, color=color.red,  title="SMA Slow")
Applying to TradingView
- Open TradingView's Pine Editor
- Paste the contents of the generated
.pinefile → Save → Add to chart - Configure an alert to forward signals to alpha-strike (see integration guide)
See TradingView Pine Script Integration for full details.
Next Steps
- End-to-End Strategy Development Workflow — full workflow walkthrough
- CLI Reference: backtest — all commands and options in detail
- CLI Reference: optimize — advanced optimization options
- Strategy Gallery — real strategy JSONs with command examples