alpha-visualizer
alpha-visualizer is the OSS package that visualizes AlphaForge backtest results in your web browser — outputs from alpha-forge backtest run and friends. It reads backtest_results.db (SQLite) and strategy JSON files directly, so it works on hosts without alpha-forge installed.
How it connects to AlphaForge
Run alpha-forge backtest run <SYMBOL> --strategy <id> and the CLI ends with "📊 You can review the chart with alpha-vis serve". That message is the entry point to alpha-visualizer, which renders the same result as Equity / Drawdown / trades / metric comparisons in a browser. AlphaForge itself is commercial, but the result-visualization layer is open source. See Getting Started → Next steps: Visualize and the End-to-End Strategy Workflow for the first integration steps.
What you can do
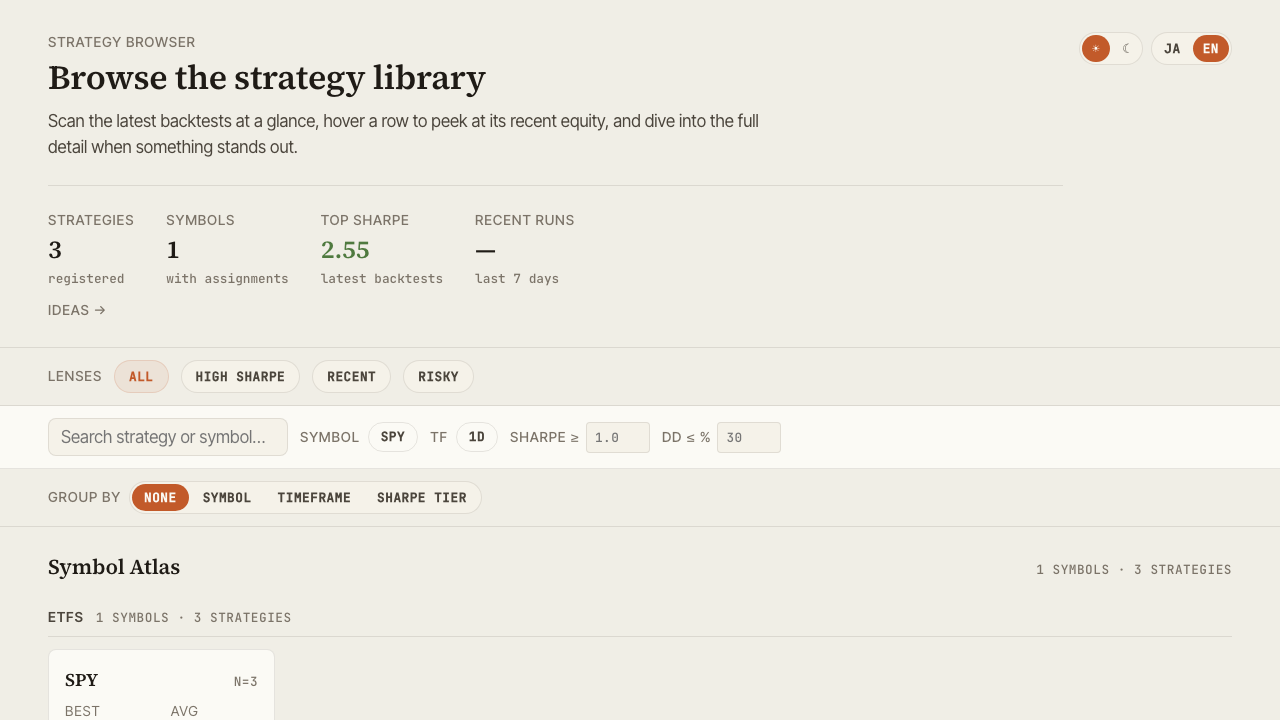
- Browse, search, and multi-select your strategy library
- Inspect equity / drawdown / trade history with benchmark metrics (alpha, beta, IR, correlation)
- Compare strategies side-by-side, including a Pearson correlation heatmap
- Visualize Walk-Forward composite equity and Grid optimization results
- Reconcile live trading against backtest with period-aligned diff
- Track exploration ideas with status and tag filters
- Toggle dark/light theme and Japanese/English UI
- Export CSV / PNG, share state via URL
Documentation map
| Page | Contents |
|---|---|
| Installation | uv / pip / from source — three installation paths |
| Features | Browse / Detail / Compare / Optimize / Live / Ideas walkthroughs |
| Configuration | CLI options, forge.yaml, data path resolution |
| FAQ & Troubleshooting | Common issues and fixes |
License & repository
- License: Apache-2.0
- GitHub: https://github.com/alforge-labs/alpha-visualizer
- PyPI: https://pypi.org/project/alpha-visualizer/
- Code of Conduct: Contributor Covenant v2.1
alpha-forge itself is commercial, but alpha-visualizer is developed independently as open source.